 OK, this is it. I’ll stop with all these posts about Toronto House Prices metrics after today. I’ll find another way to annoy people next week.
If you’ve been paying attention I said the press is consistently using entirely the wrong metric to look at house prices. It doesn’t matter what the average house costs compared to the average income, what matters is the percent of income required to buy the average house.
But even that isn’t a good metric, as existing homebuyers who have built up great equity really aren’t hurt much by the run-up in prices.
So in this price escalation, the one thing that really matters is the effect on new homebuyers. And to look at that I’m introducing my third and final metric.
The banks will lend let’s say up to a level where a person’s housing debt service ratio is 30% of income. (The actual number may be higher but given potential credit card debt, I’m using this number as the limit for the sake of analysis – it’s called “Fun With Assumptions.”)
What matters given this limit is how long it takes to save a down payment (or borrow it from relatives.) The only way we can look at this effect is to look at the number of months it takes a new buyer to save enough money so that debt service payments are 30% of income.
You can berate my assumptions in comments but I’m assuming for the sake of analysis that the average buyer can save 10% of their pretax income for a down payment. So the question becomes then how long does it take to save for a house?
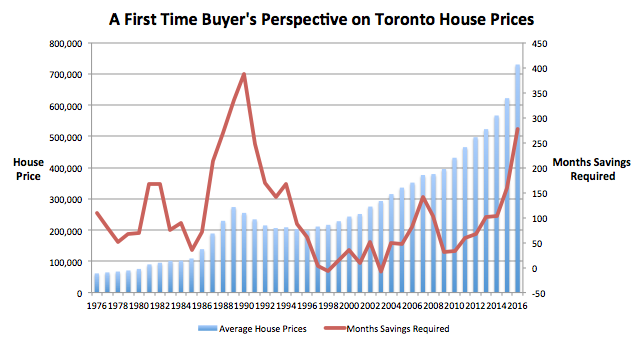
And this is where we have a problem and our mini-bubble is in crisis mode. The graph above shows house prices in blue and the red line represents the number of months savings required. This number is well above historical norms and is exceeded in level, only by the years 1988 – 1990. If you remember that time we had a huge correction in house prices
But here’s the problem. As we saw yesterday, the run-up in progress isn’t a problem for people who already own houses. It may not be a problem for foreign buyers, many of who will see Toronto as a reasonably priced market. But it will be a major problem for first time buyers. And this is really the only metric that matters now.
Is this going to be enough to bring the market to its knees? Who knows? The last time we had a big crash, prices were bad for everyone. Now they’re only bad for a few. And that’s the problem with this bubble. Since it isn’t caused by rates and is caused by price run-up it is a different type of bubble.
Only when you use the right metrics can you see what the bubble really means.
