Several weeks ago, someone made a comment on a post of mine alleging that the “growth at all cost” model got destroyed in the 2nd half of 2022 and thus that in the battle between growth vs profit, profit now wins. He also disputed my claim that “losing money works as long as the company is growing well.” Challenge accepted.
First off, let’s look at Snowflake, the cloud data platform. Their revenue grew last year at 69% and they had losses equal to 39% of revenue. The market rewarded them with a revenue multiple of 24.3 times. Yes, it was down from when they went public in 2019 but then who expects a company to keep up growth of 174%.
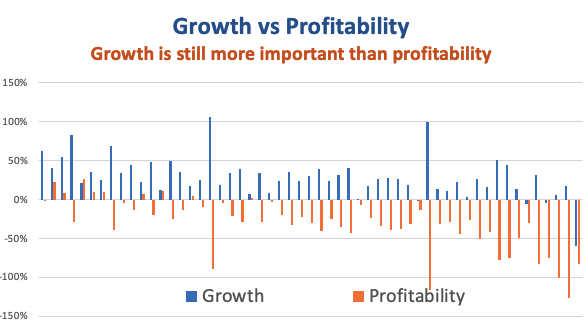
I can give lots of examples but what I prefer to look at is the story of all of these companies. To do this, I went and looked at the data on 55 software companies that went public from 2018 to 2021 (I’ll add to this sample another time) and here’s what I found.
When these companies went public 87% were losing money and for their last fiscal, 84% were losing money. Obviously being profitable isn’t as critical as people think.
In fact, the average rate of losses only went down from 32% to 29% since they went public.
Meanwhile the rate of revenue growth declined from 53% to 29%.
And what happened to their revenue multiple? It went on average from 26.6 times to 7.5 times.
Yes, the market has declined and revenue multiples are lower but it is now in a reasonable range given lower growth rates. And revenue growth is still king. In fact, the correlation between revenue growth and the revenue multiple has just fallen from 0.57 to 0.37. Meanwhile, the correlation between profit and the revenue multiple went from -0.50 to 0.03. Now at least there isn’t a negative correlation between profit and valuation, profitability is just totally unimportant.
So those of you who are talking to potential and existing investors, in the battle between growth vs profit, keep pushing for growth. Your investors (including you) will earn more in the long run.
Yesterday, SunLife announced its intention to acquire Dialogue for $5.15 a share. While it’s great that it was bought by a Canadian firm, it is disappointing that Canada lost another chance to create a world leading company. When things like this happen, I like to look at the economics of the company to see what they did right and what they might have done better. Fortunately, as a public company, there is lots of information on Dialogue.
Dialogue raised $100 million to go public in 2021 at a price of $12 per share, quickly rising to $17.70 but they eventually fell to $3.11 per share. Their recent sale at $5.15 recouped some of the shareholders losses but overall, they raised $465 million, went public with a value of $850 million so somebody lost money on this horse. My bet is that it was the public.
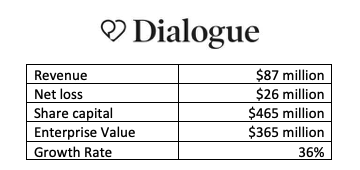
When they undertook their IPO, they looked like a total darling. With growth in the prior two years of 150% and 258%, they were rocking it. But the warning signs were there. They had raised $115 million to get to $35 million in revenue, a ratio of 3.3 times when the average in the industry at time of IPO is 2.18 times. They certainly weren’t a poster child for Canada’s claims of capital efficiency.
So, what got them to this point? When they went public, they were spending 64% of gross profit on marketing and sales, close to the IPO average of 71%. M&S was 2 times R&D, once again close to the average of 2.1 times. But they were hemorrhaging cash on general and admin at 57% of revenue, way beyond the IPO average of 21%. So, their spending on M&S and R&D propelled superb growth and overspending on G&A created losses of 57% on sales, well above the IPO average of 28%.
Then what happened? Well they must have had cold feet, and someone stopped spending on M&S. Spending on M&S declined as a percent of gross profit to 28% and growth fell to 36%. Not bad but not good enough to play with the big boys. R&D gained ascendancy and the ratio between M&S and R&D fell to 1.2 times while G&A continued on its bloated journey to 98% of gross profit. Losses of $26 million continued their weak record at capital efficiency which was now 5.3 times.
They probably sat at the end of 2022 with $63 million of cash in the bank and wondered what to do now. Huge losses and falling growth rates meant that they weren’t going to be able to raise more capital expect maybe at a punitive cost. They faced the prospect of continued decline in share value and probably figured they should get out while the getting out was possible.
As I see it, there were two major problems here.
They were spending enough on M&S to fuel great growth, but they stopped doing that and growth declined.
They were spending way too much on G&A, hemorrhaging cash because of it, driving down capital efficiency.
So sad that we lost another chance to create a world leading firm. I hope the founders made some good money on this and that they live to be founders again.
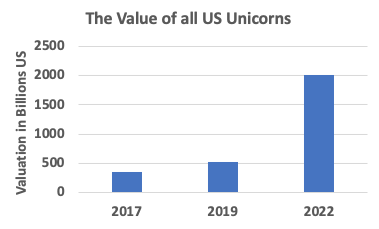
In early 2017, the US had 96 Unicorns. By early 2019 this count was up to 147 and last week the count was 644. That little stat blew my mind but then I looked at US Unicorn Valuations and was frankly shocked. If you want to look, check it out on CB Insights.
I’ve been collecting stats for a while and I find it very useful to go back and see where we have come from. In early 2017, I wanted to develop a stat that could easily express the valuation of companies. Now we really aren’t talking about a true valuation but one used for the issuance of preferred shares to VCs. Since these shares have a one or sometimes two times liquidation preference, the number computed for “valuation” is really more of a conversion threshold. This is the value at which VCs would be willing to convert their shares to common in an exit and not utilize the liquidation preference. (I may have butchered this explanation but it isn’t germane to what I saw anyway.)
Anyway, the stat I use to look at valuations is the Capital Multiple. This measures a company’s valuation relative to the amount of capital raised. It is calculated by dividing the valuation of a firm by the total amount of capital it has raised to date. I could go into a long explanation of why this multiple works to think about valuation and if you want me to, let me know.
When I last did the research, the Capital Multiple for Series A financings was sitting at about 4.7 times. That is the post money ‘Valuation” was equal to 4.7 times the total amount raised by the firm. In 2017, the average capital multiple for US based Unicorns was 5.8 times. That didn’t change much till early 2019 as by then the average was 5.5 times.
But by last week, the average Capital Multiple for US based Unicorns was 6.9 times. With the increase in numbers of Unicorns, the amount of capital invested in Unicorns had risen from $67 billion to $354 billion. But more than that, the total valuation of all Unicorns had risen from $360 billion to a whopping $2 trillion.
The Incredible Rise in Unicorn Valuations
It takes a while for the private market valuations to fully reflect changes in public markets. But given the decline in the value of public tech stocks recently, I imagine there are going to be a few disappointed entrepreneurs and investors when they have to raise their next round of capital back in a normal valuation range.
Part of our national angst bemoans the lack of Canadian investors in Canadian Unicorns. I used to think that was a problem but lately I’ve come to think I was wrong. This new thinking was emphasized by a blog by Danilo Tominovic. Danilo has done a good job raising the issue but there appears to be a bit of data missing from the list in his blog. I can’t resist a good bit of research so here we go.
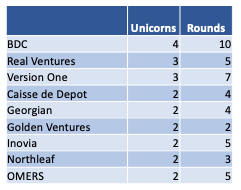
According to CBInsights, we have 19 Unicorns. That’s like 17 more than a couple of years ago so we’re heading in the right direction. These Canadian Unicorns have a total of 408 investors including duplicates. Most of these are institutional except primarily for Dapper Labs which has whack-load (116) of investors, most of them angels (shout out to Ashton Kutcher). I didn’t count Canadian Angels but I did count Canadian VCs and there are 37 Canadian VCs that made 52 investments in 85 rounds.
I guess the question is whether 52 investments out of 408 is a good result. On the surface it would appear that we don’t seem very supportive of Canadian companies but then you can look at it another way. It’s probably the ratio that one should expect. After all, an international firm should be getting funding internationally and given that Canada has less than 10% of the capital available internationally, we should expect that a successful international scaleup should have less than 10% Canadian funding. So having 13% of the investments isn’t doing too bad for now.
I love to make lists so I’ve made another one. Here are the Canadian VCs active in investing in Canadian Unicorns. I’ve included the nine firms with more than one investment for your edification and enjoyment.
From only two Unicorns at the end of 2020 to 19 today shows the incredible growth in just one year in the Canadian tech ecosystem. We recently released our 2022 Narwhal List which showcases those private Canadian tech companies that are scaling successfully as of January 1.
The 2022 list shows that:
Narwhals raised an astounding $6.9 billion last year, up from $1.1 billion.
Employment levels in Narwhals increased 58% over the last two years from 17 thousand to over 29 thousand.
In 2020 there were 52 companies that are scaling at a level that will potentially propel them to Unicorn status and the current list shows 151 companies at that level.
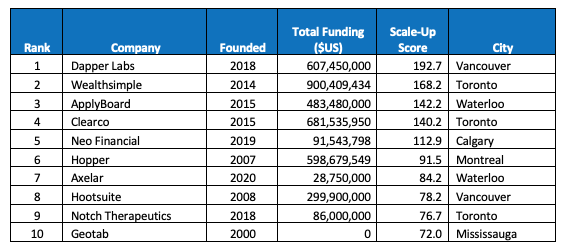
The influx of foreign funds into Canada over the last several years is fuelling this unprecedented growth. It is giving world class companies the chance to grow and stay Canadian. This is the list of Canada’s top 10 Narwhals.
In addition to a list of Canadian unicorns, the Narwhal List showcases the 40 leading computer technology firms and 10 in each of health and clean and health technologies.
2021 was an incredible year for Canadian Narwhals. In particular, eight companies from last year’s list went public. (Mindbeacon, Coveo, Dialogue, D2L, Thinkific, Q4, Medavail, Li-cycle).
In a reversal of a long-term trend, only two companies were sold. (Ecobee and Precision Nano)
Toronto is home to 26 Narwhals followed by Vancouver at 19 and Montreal at nine.