I spend a fair bit of time trying to develop frameworks to guide business analysis and in a meeting yesterday I realized that the one I had adopted to ask companies about their business strategy was too loosey goosey. The four strategic questions I typically asked were:
Who are you selling to?
What are their needs?
How are you meeting those needs?
How are you beating the competition?
I am finding those questions can be answered very broadly and in not enough detail to be valuable. This lack of specificity often extends to the marketing plan, to collateral material, to websites and to fundraising. I’m trying to get more specific in order to improve a company’s ability to go to market and drive growth. As a result, I am experimenting with changing the questions being asked to the following:
What is the industry and title of the person you are selling to?
This is much more specific as it is easy to define the industry within which we are trying to solve a problem. Defining a title is more difficult as you have to understand the industry and the problem so well that you know who is tasked with solving it. Understanding this enables you to do a better job as well in targeting your prospective client.
What problem are they motivated to solve?
This gets tricky because most startups define a problem that they see and not one that the target buyer sees. And the current answer may mean that the person has a problem, but they might not care about the problem, have a budget or be motivated to solve the problem. In order to be motivated to solve a problem, I think there are three things that must exist.
Do they have a budget and if not, where are they going to get one?
Does your buyer need to solve this problem due to external motivation: it is in their list of job responsibilities, part of their annual plan job plan and is their performance appraisal dependent on solving the problem
Does the problem cause the buyer so much pain that they are personally motivated to solve it?
What you might find is that you have to go upstream in a company and solve a more generalized problem related to quality, speed or cost if the specific one is not on the to do list. This will take more time as the specific problem will need to be added to the individual employee’s work plan for the year. This typically occurs in cases where there is not an existing market for a particular technology and you’re trying to create the market.
How much value do you bring in solving this problem?
This is a trickier question to answer than dealing just with the product features you are bringing to bear. This gets down to benefits of the solution. And here you must get very specific, not just dealing with general terms like reducing cost. You must be able to measure the benefits. How much cost is reduced, how much faster, how can you measure quality improvements?
How can you measure material differences in value delivery from the competition?
Once again, not just the features of your solution but what are the benefits you bring and how are they different from the benefits your solution brings.
This is a work in progress so don’t be surprised if I keep on refining this.
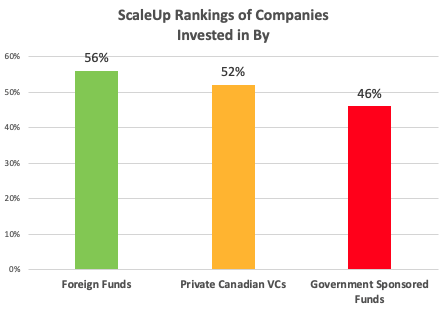
When the government says it isn’t in the business of picking winners, they’re right. The data shows that they are no good at it. I crunched the numbers to see who is backing winners and the results are clear. Canadian companies backed by foreign investors are scaling faster than those invested in by Canadian VCs and those beat ones supported by government VCs. Looking at company stats for 2,356 investments by 1,161 investors in 886 Scaling Canadian tech companies shows a definite pattern.
Foreign funds are either picking the best companies to invest in or providing them with better resources. And as can be seen from the list below, Canadian government entities have the worst record among these three groups.
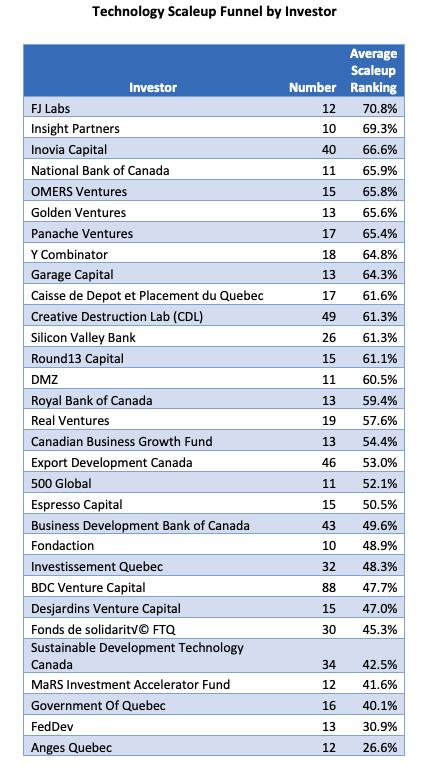
Now I know that a Scaleup Ranking isn’t the same as the level of return to investors, but it is correlated with growth which in itself is a major factor in valuation. I’ve put the list of major investors and the Scaleup rankings of companies they back below but before we get to that there are a few questions we should be asking ourselves:
Are foreign VCs just better at picking winners?
Or do they add more value?
And a big question is should the government be playing this game at all?
For your enjoyment and edification, I’ve included the list of VCs with more than 10 companies in Crunchbase’s record of top 5 investors. Don’t stress out, it’s just a list, not the definitive word but an attempt to shine a light on what’s happening in the Canadian ecosystem.
I’m wondering when Canadian firms are going to realize that getting their initial revenue in Canada is slowing down their progress and that they need an export first mentality. Yes, this is a rant. I met another example yesterday. When we were starting Synamics as a telecommunication software provider, we obtained some crucial advice from an individual who, at the time, was the CEO of Nortel. His advice was that we should learn to swim in our own bay before trying to sail in the big lake. He actually used this expression and what he meant was that we should build a big business in Canada before going to the US to expand it. We dutifully followed this advice for many years and kept running into a revenue ceiling we couldn’t break through. Finally, getting fed up with lackluster growth, we just started selling in the US and England and lo and behold, growth took off.
Most Canadian tech firms I meet get their first revenue in Canada and only proceed to the US or other foreign countries when they feel better about the risk. But starting in Canada is starting in a small market and a critical component in creating large companies is a large market: larger markets result in larger-sized companies. (Duh!) Look at Shopify for proof. Only about 3% of its ‘stores’ are located in Canada. If it had not chosen to get out of Dodge, its revenue would be under $200 million instead of over $5 billion.
For Canadians, launching in Canada first is typically the easiest route to early revenue. But this strategy slows down company development. Canada is not a big enough market within which to build a large firm. And Canadian buyers buy for different reasons and differently than say Americans. US companies are larger and thus their operational needs are different. They are subject to different regulations and different competitive forces. There are differences in consumer habits as well, mostly related to competitive pressures. Thus, the solutions they need will be different from the solutions a Canadian buyer will need.
A startup that launches sales first in Canada will get revenue, but it won’t learn enough about competitive differentiation or product/market fit from that launch. It may end up having to change its product when finally going to a bigger market as well. Thus, a launch first in Canada will inevitably slow down the growth of the firm as it must learn two markets instead of one and even perhaps build two different products.
Several weeks ago, someone made a comment on a post of mine alleging that the “growth at all cost” model got destroyed in the 2nd half of 2022 and thus that in the battle between growth vs profit, profit now wins. He also disputed my claim that “losing money works as long as the company is growing well.” Challenge accepted.
First off, let’s look at Snowflake, the cloud data platform. Their revenue grew last year at 69% and they had losses equal to 39% of revenue. The market rewarded them with a revenue multiple of 24.3 times. Yes, it was down from when they went public in 2019 but then who expects a company to keep up growth of 174%.
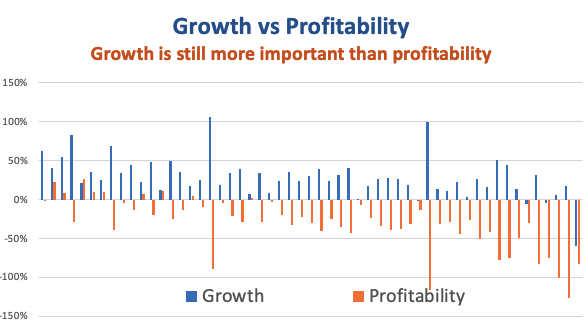
I can give lots of examples but what I prefer to look at is the story of all of these companies. To do this, I went and looked at the data on 55 software companies that went public from 2018 to 2021 (I’ll add to this sample another time) and here’s what I found.
When these companies went public 87% were losing money and for their last fiscal, 84% were losing money. Obviously being profitable isn’t as critical as people think.
In fact, the average rate of losses only went down from 32% to 29% since they went public.
Meanwhile the rate of revenue growth declined from 53% to 29%.
And what happened to their revenue multiple? It went on average from 26.6 times to 7.5 times.
Yes, the market has declined and revenue multiples are lower but it is now in a reasonable range given lower growth rates. And revenue growth is still king. In fact, the correlation between revenue growth and the revenue multiple has just fallen from 0.57 to 0.37. Meanwhile, the correlation between profit and the revenue multiple went from -0.50 to 0.03. Now at least there isn’t a negative correlation between profit and valuation, profitability is just totally unimportant.
So those of you who are talking to potential and existing investors, in the battle between growth vs profit, keep pushing for growth. Your investors (including you) will earn more in the long run.
Yesterday, SunLife announced its intention to acquire Dialogue for $5.15 a share. While it’s great that it was bought by a Canadian firm, it is disappointing that Canada lost another chance to create a world leading company. When things like this happen, I like to look at the economics of the company to see what they did right and what they might have done better. Fortunately, as a public company, there is lots of information on Dialogue.
Dialogue raised $100 million to go public in 2021 at a price of $12 per share, quickly rising to $17.70 but they eventually fell to $3.11 per share. Their recent sale at $5.15 recouped some of the shareholders losses but overall, they raised $465 million, went public with a value of $850 million so somebody lost money on this horse. My bet is that it was the public.
When they undertook their IPO, they looked like a total darling. With growth in the prior two years of 150% and 258%, they were rocking it. But the warning signs were there. They had raised $115 million to get to $35 million in revenue, a ratio of 3.3 times when the average in the industry at time of IPO is 2.18 times. They certainly weren’t a poster child for Canada’s claims of capital efficiency.
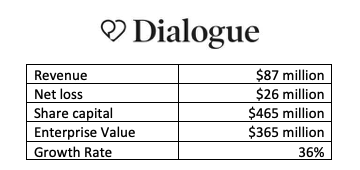
So, what got them to this point? When they went public, they were spending 64% of gross profit on marketing and sales, close to the IPO average of 71%. M&S was 2 times R&D, once again close to the average of 2.1 times. But they were hemorrhaging cash on general and admin at 57% of revenue, way beyond the IPO average of 21%. So, their spending on M&S and R&D propelled superb growth and overspending on G&A created losses of 57% on sales, well above the IPO average of 28%.
Then what happened? Well they must have had cold feet, and someone stopped spending on M&S. Spending on M&S declined as a percent of gross profit to 28% and growth fell to 36%. Not bad but not good enough to play with the big boys. R&D gained ascendancy and the ratio between M&S and R&D fell to 1.2 times while G&A continued on its bloated journey to 98% of gross profit. Losses of $26 million continued their weak record at capital efficiency which was now 5.3 times.
They probably sat at the end of 2022 with $63 million of cash in the bank and wondered what to do now. Huge losses and falling growth rates meant that they weren’t going to be able to raise more capital expect maybe at a punitive cost. They faced the prospect of continued decline in share value and probably figured they should get out while the getting out was possible.
As I see it, there were two major problems here.
They were spending enough on M&S to fuel great growth, but they stopped doing that and growth declined.
They were spending way too much on G&A, hemorrhaging cash because of it, driving down capital efficiency.
So sad that we lost another chance to create a world leading firm. I hope the founders made some good money on this and that they live to be founders again.
In early 2017, the US had 96 Unicorns. By early 2019 this count was up to 147 and last week the count was 644. That little stat blew my mind but then I looked at US Unicorn Valuations and was frankly shocked. If you want to look, check it out on CB Insights.
I’ve been collecting stats for a while and I find it very useful to go back and see where we have come from. In early 2017, I wanted to develop a stat that could easily express the valuation of companies. Now we really aren’t talking about a true valuation but one used for the issuance of preferred shares to VCs. Since these shares have a one or sometimes two times liquidation preference, the number computed for “valuation” is really more of a conversion threshold. This is the value at which VCs would be willing to convert their shares to common in an exit and not utilize the liquidation preference. (I may have butchered this explanation but it isn’t germane to what I saw anyway.)
Anyway, the stat I use to look at valuations is the Capital Multiple. This measures a company’s valuation relative to the amount of capital raised. It is calculated by dividing the valuation of a firm by the total amount of capital it has raised to date. I could go into a long explanation of why this multiple works to think about valuation and if you want me to, let me know.
When I last did the research, the Capital Multiple for Series A financings was sitting at about 4.7 times. That is the post money ‘Valuation” was equal to 4.7 times the total amount raised by the firm. In 2017, the average capital multiple for US based Unicorns was 5.8 times. That didn’t change much till early 2019 as by then the average was 5.5 times.
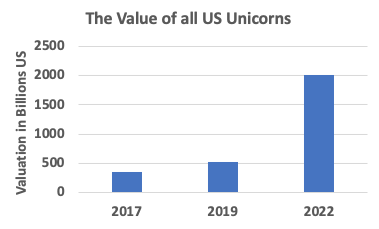
But by last week, the average Capital Multiple for US based Unicorns was 6.9 times. With the increase in numbers of Unicorns, the amount of capital invested in Unicorns had risen from $67 billion to $354 billion. But more than that, the total valuation of all Unicorns had risen from $360 billion to a whopping $2 trillion.
The Incredible Rise in Unicorn Valuations
It takes a while for the private market valuations to fully reflect changes in public markets. But given the decline in the value of public tech stocks recently, I imagine there are going to be a few disappointed entrepreneurs and investors when they have to raise their next round of capital back in a normal valuation range.