I spend a fair bit of time trying to develop frameworks to guide business analysis and in a meeting yesterday I realized that the one I had adopted to ask companies about their business strategy was too loosey goosey. The four strategic questions I typically asked were:
Who are you selling to?
What are their needs?
How are you meeting those needs?
How are you beating the competition?
I am finding those questions can be answered very broadly and in not enough detail to be valuable. This lack of specificity often extends to the marketing plan, to collateral material, to websites and to fundraising. I’m trying to get more specific in order to improve a company’s ability to go to market and drive growth. As a result, I am experimenting with changing the questions being asked to the following:
What is the industry and title of the person you are selling to?
This is much more specific as it is easy to define the industry within which we are trying to solve a problem. Defining a title is more difficult as you have to understand the industry and the problem so well that you know who is tasked with solving it. Understanding this enables you to do a better job as well in targeting your prospective client.
What problem are they motivated to solve?
This gets tricky because most startups define a problem that they see and not one that the target buyer sees. And the current answer may mean that the person has a problem, but they might not care about the problem, have a budget or be motivated to solve the problem. In order to be motivated to solve a problem, I think there are three things that must exist.
Do they have a budget and if not, where are they going to get one?
Does your buyer need to solve this problem due to external motivation: it is in their list of job responsibilities, part of their annual plan job plan and is their performance appraisal dependent on solving the problem
Does the problem cause the buyer so much pain that they are personally motivated to solve it?
What you might find is that you have to go upstream in a company and solve a more generalized problem related to quality, speed or cost if the specific one is not on the to do list. This will take more time as the specific problem will need to be added to the individual employee’s work plan for the year. This typically occurs in cases where there is not an existing market for a particular technology and you’re trying to create the market.
How much value do you bring in solving this problem?
This is a trickier question to answer than dealing just with the product features you are bringing to bear. This gets down to benefits of the solution. And here you must get very specific, not just dealing with general terms like reducing cost. You must be able to measure the benefits. How much cost is reduced, how much faster, how can you measure quality improvements?
How can you measure material differences in value delivery from the competition?
Once again, not just the features of your solution but what are the benefits you bring and how are they different from the benefits your solution brings.
This is a work in progress so don’t be surprised if I keep on refining this.
There’s lots of talk about there being a housing bubble in Toronto and finally after 10 years of claiming this, people are right. I guess if you keep crying fire, eventually one will happen, and you’ll be right.
What has happened to bring this bubble about is, of course, the increasing rate of interest being charged on mortgages. The metric (did I tell you I love metrics) that really matters is the percent of a homeowner’s income that needs to be spent to pay for a mortgage. And if you look at the following graph, you’ll see that this has never been higher. (OK, maybe it was a trifle higher in 1989 but not much.)
Ideally, a mortgage might take up 30% to maybe 35% of a household’s income. Right now it takes 57.3% of the average Torontotonian’s family income to afford a mortgage on the average house in Toronto. That is bubble zone.
Way back in 2017, pre pandemic and all that, I wrote a series of blogs looking at the housing market. The first blog pointed out the oft adopted fallacy of comparing house prices to income. What I said there was that what really matters is what you have to pay in a mortgage to buy a house.
The second blog berated the Globe and mail for their demand that the government do something about surging house prices. In that blog I showed that there wasn’t a house price problem for anyone who owned a house and wanted to keep it or for those wanting to trade up. In fact, affordability had improved for that group as declining mortgage rates had improved affordability.
No, the real problem then was for new buyers. That blog showed that increasing prices made saving to buy a house a herculean task. It wasn’t as bad as 1989 but it was clearly a problem.
Right now, it is not only too expensive for a new buyer to enter the market, but it is too expensive for many homeowners to carry their house if their interest rate increases. And it is too expensive for landlords to continue to rent their houses. Now the fact that there is a bubble doesn’t necessarily mean that house prices will decline as there are four things that could happen:
Interest rates could come down again
Inflation could boost salaries
Homeowners could stop eating so that they could afford their mortgages
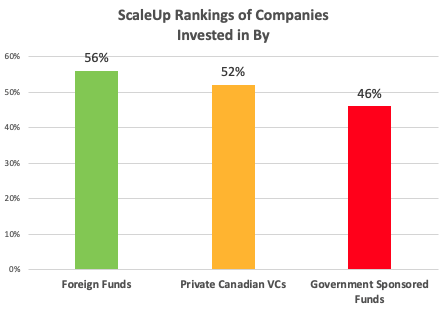
When the government says it isn’t in the business of picking winners, they’re right. The data shows that they are no good at it. I crunched the numbers to see who is backing winners and the results are clear. Canadian companies backed by foreign investors are scaling faster than those invested in by Canadian VCs and those beat ones supported by government VCs. Looking at company stats for 2,356 investments by 1,161 investors in 886 Scaling Canadian tech companies shows a definite pattern.
Foreign funds are either picking the best companies to invest in or providing them with better resources. And as can be seen from the list below, Canadian government entities have the worst record among these three groups.
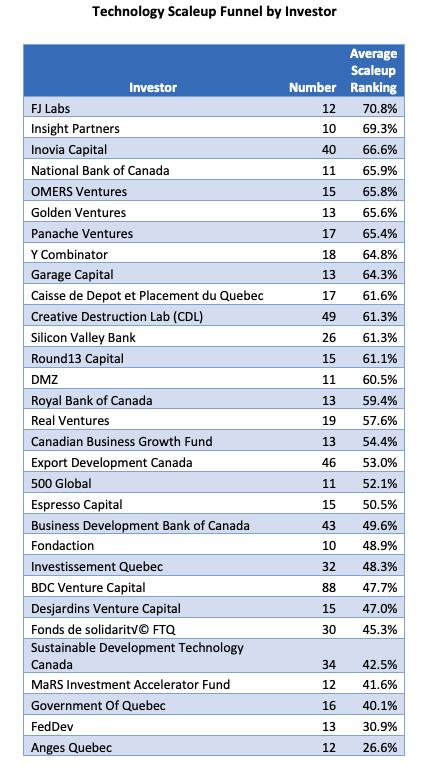
Now I know that a Scaleup Ranking isn’t the same as the level of return to investors, but it is correlated with growth which in itself is a major factor in valuation. I’ve put the list of major investors and the Scaleup rankings of companies they back below but before we get to that there are a few questions we should be asking ourselves:
Are foreign VCs just better at picking winners?
Or do they add more value?
And a big question is should the government be playing this game at all?
For your enjoyment and edification, I’ve included the list of VCs with more than 10 companies in Crunchbase’s record of top 5 investors. Don’t stress out, it’s just a list, not the definitive word but an attempt to shine a light on what’s happening in the Canadian ecosystem.
I’m wondering when Canadian firms are going to realize that getting their initial revenue in Canada is slowing down their progress and that they need an export first mentality. Yes, this is a rant. I met another example yesterday. When we were starting Synamics as a telecommunication software provider, we obtained some crucial advice from an individual who, at the time, was the CEO of Nortel. His advice was that we should learn to swim in our own bay before trying to sail in the big lake. He actually used this expression and what he meant was that we should build a big business in Canada before going to the US to expand it. We dutifully followed this advice for many years and kept running into a revenue ceiling we couldn’t break through. Finally, getting fed up with lackluster growth, we just started selling in the US and England and lo and behold, growth took off.
Most Canadian tech firms I meet get their first revenue in Canada and only proceed to the US or other foreign countries when they feel better about the risk. But starting in Canada is starting in a small market and a critical component in creating large companies is a large market: larger markets result in larger-sized companies. (Duh!) Look at Shopify for proof. Only about 3% of its ‘stores’ are located in Canada. If it had not chosen to get out of Dodge, its revenue would be under $200 million instead of over $5 billion.
For Canadians, launching in Canada first is typically the easiest route to early revenue. But this strategy slows down company development. Canada is not a big enough market within which to build a large firm. And Canadian buyers buy for different reasons and differently than say Americans. US companies are larger and thus their operational needs are different. They are subject to different regulations and different competitive forces. There are differences in consumer habits as well, mostly related to competitive pressures. Thus, the solutions they need will be different from the solutions a Canadian buyer will need.
A startup that launches sales first in Canada will get revenue, but it won’t learn enough about competitive differentiation or product/market fit from that launch. It may end up having to change its product when finally going to a bigger market as well. Thus, a launch first in Canada will inevitably slow down the growth of the firm as it must learn two markets instead of one and even perhaps build two different products.
Our national “productivity gap” has spurred analyses, reports, and media articles for decades. While public debate in Canada has focused on productivity improvement for over 50 years, we have made limited progress. Fresh thinking is required.
While Innovation through R&D is certainly important to productivity growth – and has preoccupied the federal government over the last half century – there is also a connection between firm size and productivity. The larger the firm, the more productive it typically is. Logically then – and the research supports this proposition – one way to increase our productivity is to grow our firms from small and medium, to large-size. Something we have failed to do.
And one clear factor keeping our firms from growing like those south of the border is that Canadian firms spend less on marketing and sales (M&S) than US firms as a percentage of revenue. A related issue is that Canadian firms have difficulty finding local M&S executives and must hire for this role internationally.
The stark fact is Canada has the lowest number of manufacturing companies with over 250 employees per 1 million in population in the OECD. While progress has been made on some fronts, we lag behind our competitors. Solving Canada’s perennial productivity problem will partially be addressed by creating companies that scale from start-up to world-class status.
There are a number of explanations as to why Canadian companies have issues doing so, but the fundamental factor comes down to marketing and sales.
As they start, our companies enter smaller markets than those entered by US firms, thus limiting their rate of growth and potential long-term size. Then as they grow, firms founded in Canada wait until later to raise capital, raise smaller rounds and raise less than US firms and, as a result, grow more slowly. While a lack of funding in Canada is often mentioned as a challenge, firms have significant access to foreign capital even at earlier stages of development but receive less money and grow slower when accessing Canadian funders.
When it comes to how Canadian firms allocate their expenditures, our scaling firms spend more on R&D than US firms as a percentage of revenue, but this has yet to result in higher growth despite innovation often being touted as the most critical factor in driving growth.
In addition, the data do not show that patenting is a factor. For example, Canadian software firms that engage in patenting take out more patents per firm and more patents per dollar invested than their US counterparts.
The net result of these challenges is that firms that grow slower than comparable US firms at a later stage of scaling up and are unable to access the large amounts of capital necessary to propel them to world class status. Typically, they are sold first.
Various levels of government also focus too heavily on research and innovation and productivity improvement in small firms – not enough on the creation of larger firms. And what is keeping our firms smaller and growing slower is the lack of resources, experience, and talent for commercialization – that is, the domain of marketing and sales.
Our challenges in market size, M&S personnel, and M&S spending are all related to marketing as a function. M&S is a significant factor for companies in driving growth and thus helping create the large firms necessary to increase our country’s productivity. However, M&S is the area in which Canada has its most significant challenges, making the biggest area for policy to play a role.
A focus on R&D is necessary but not sufficient. Perhaps after years of focusing on R&D and not seeing expected changes in productivity, the government might experiment with improving the ability of firms to compete on the international stage with enhancements to programming for M&S. Such changes may include:
· Setting productivity goals and measuring results.
· Moving the national conversation away from just focusing on research and patenting towards more discussion of the role that M&S has to play in creating large companies.
· Reducing the focus on STEM careers and promoting careers in M&S.
· Decreasing SRED credits on internal productivity and increasing credits for new product creation.
· Streamlining the many programs devoted to IP creation and protection and implementing programs that partially fund export oriented M&S activities.
After years of marginal improvements to productivity, it is time to change our thinking. Instead of focusing only on R&D and seeing limited results, we should acknowledge the role that M&S plays in creating large firms and experiment with policies and programs that focus on their growth. This is the missing ingredient.