by Charles Plant | Oct 30, 2018 | Entrepreneurship
This report on the Land of Stranded Pilots examines the shape of the health technology (health tech) industry in Canada with a focus on three specific questions: Does Canada actually have a problem with health tech commercialization? If so, how extensive is that problem? And what is causing it?
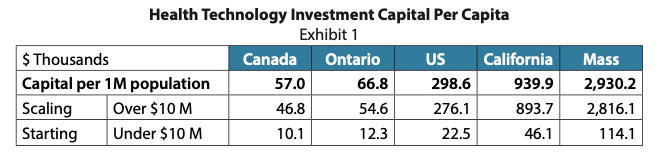
Health technologies can be divided into three primary areas: health tech software, devices and equipment for health, and biotechnology, drug discovery and development. Our review of active health tech companies in Canada and the US can be summarized in Exhibit 1. We have sorted the firms by whether they are “starting” or “scaling”, using $10 M as a cut-off between early-stage and growth (i.e. scaling) companies.
The US has five times as much capital on a population basis available to both new and growing companies. The gap grows even further for more established businesses: our neighbour has six times as much investment capital for companies that are scaling. Within the US, Massachusetts is the clear winner at overall capital and in the scale-up of companies. Relative to Ontario, it has 43 times more total capital and 51 times more investment resources for growth companies.
Canada’s underperformance, especially when we consider the wide margin in all areas of health technology, is astounding. For this reason, we will dedicate the remainder of this report to a systemic analysis of the innovation system and its components. Our analysis suggests three major factors in the underperformance.
- There is no alignment of research dollars and researchers with commercialization objectives.
- From the perspective of the entrepreneur, the system for commercializing health technology is a byzantine and flawed system with multiple overlapping, competitive, and duplicated parts with funding and assistance gaps.
- The healthcare system is not aligned to purchase the innovation that comes out of the health tech system, and in fact, can act as a brake on innovation.
This brief is not intended to be a criticism of any organization in the system or the individuals that work for those organizations. We truly have a system and people within it who are trying to do the very best job they can for their clients. Governments at all levels too are keen to develop solutions to problems in the system and have been launching new programs on a regular basis to fix problems that have been identified. All of the players are doing an excellent job meeting the needs for which they were established and addressing issues within their sphere of influence.
The problem is centered on the gradual evolution of the system as a whole. The piecemeal design over decades has created inefficiencies that no amount of hard effort by the participants in the system can change. The health tech innovation system has no measurable objectives and is plagued by misalignments, gaps, competition, and overlapping resources. The system design is flawed and must be fixed if we are to compete in health technology innovation.
Read The Land of Stranded Pilots.
by Charles Plant | Sep 30, 2018 | Entrepreneurship
We’ve written a report on 10 Secrets to Scaling Up. There are more than 10 but then who’s counting? A scaleup is defined as a company with an average annual growth of at least 20% over three consecutive years. The notion of growth is critical to achieving scale, and regardless of sector, entrepreneurs work hard to grow their businesses. But how do we measure success in scaling, and what is the secret to growth?
To answer these questions, we looked at thousands of software companies to uncover their secrets to driving growth. This report sets out important growth metrics, particularly for those selling Software as a Service (SaaS).
Why Growth?
We begin with the standard formula for valuation:
valuation = revenue x revenue multiple
Growth has a dual effect on this formula: firstly, higher growth rate results in higher revenue (one dimension of the formula). And secondly, the increased growth rate increases the revenue multiple (the other dimension in the formula).
Given this relationship between growth and valuation, any company wishing to compete as a world-class business must be growing wildly to generate superlative returns for a venture capitalist (VC). Because of the dependence of returns on growth. VCs consider a 10–20% growth per month in the seed stage and 60% per year in the expansion stage as a minimum to consider a business worthy of investment. In practice, many VCs will actually only consider companies with annual growth rates of 100% as prospective investments.
Market Size & Innovation Adoption
We looked at SaaS Unicorns and public companies to learn about the impact that market size has on growth. We found that the first requirement for growth is to be situated in a large market. It is virtually impossible to grow sufficiently or quickly in a small market. History shows that high-growth companies tend to be consumer-based, serving markets that are broadly based and horizontal—rather than vertical—in nature.
After market size, the next most important factor is the rate at which the market takes up and adopts new innovations. If a new company is selling a product or service that their target market has never purchased before, the rate of diffusion will be slow. Even in a large market, poor uptake will slow down the potential growth of the company.
Read the report on 10 Secrets to Scaling Up here
Capital and People
To determine how much capital and how many people are required to drive high growth, we looked at the results of thousands of public and private software companies.
Our results suggest that an average public software company needs $1.23 of capital for every dollar of revenue earned. Capital requirements are lower for growth rates below 20%, but when growth is higher than this, substantially more capital is required. For a company that is scaling successfully, the ratio of capital to revenue should be between 1:1 and 1.5:1.
The data also shows that the amount of capital required for human resources is at least $300k-$500k per employee for rapid-growth companies. The average revenue per employee is $330k.
Thus, a company attempting to scale up should expect to raise approximately$12.5 million of capital for every $10 million of revenue (1.25:1). This would fund 30 employees (at $400k of capital per employee) and produce $10 million of revenue (at $330k revenue per employee).
We must keep in mind that how and when you raise funds also matters. Firms that raised the highest amounts in their first year of seeking capital subsequently raised far more than firms who raised less capital in their first year. The relationship is particularly strong in the first five years of fundraising, showing that there is a definite advantage to raising more money the first time you raise it.
A fine balance must be struck in terms of timing. The data shows that waiting slightly longer to raise funds generally results in a larger first round and is better correlated to higher amounts raised in the long run. However, there does not appear to be any benefit in waiting more than 5 years to raise your first round.
Driving Growth
To understand what drives growth, we partnered with Openview, a US-based VC that conducts an annual survey of SaaS companies.
We divided the companies in Openview’s database into three stages of growth: validation stage (below $1 million in revenue), efficiency stage (approaching $5 million), and scaling stage (above $5 million). Based on the analysis, we can draw some conclusions about operational variables and their relationship to growth:
- Growth declines, on average, as firms move from inception to scale. While average growth rates in the validation stage are 150%, they decline to 67% by the time firms are in the scaling stage.
- In the validation stage, businesses favour employment in marketing and sales (M&S) over research and development (R&D), at a rate of 2:1. This declines to 1.15:1 by the scaling stage.
- The higher the M&S employee composition, the higher the business growth. This correlation between employee composition and growth holds at all stages.
- Significant funds are spent on M&S at all stages. But, while the ratio of R&D to M&S stands at 1.75:1 in the validation stage, that ratio flips to 1:1.45 by the time a firm reaches the scaling stage.
- Higher spending on M&S is correlated with higher growth rates.
- The higher the burn rate, the higher the growth rate at all stages.
Read the full report on 10 Secrets to Scaling Up here.
by Charles Plant | May 30, 2018 | Entrepreneurship
Our objective for this report on the Class of 2008 was to analyze the ten-year trajectory of tech companies launched in 2008 in select jurisdictions around the world. Our current findings build on several other studies we conducted in the past and provide further insight into the challenges faced in the development of Canadian firms.
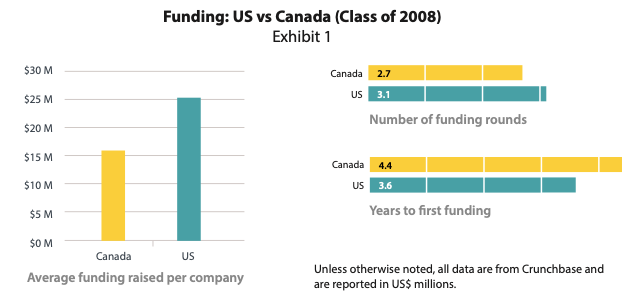
We looked at 2,429 companies created in 2008 in Canada, the US, France, Germany, and the UK; 983 were recorded by Crunchbase as having obtained capital of over $100,000 to fuel their growth. We looked at this subset in more detail.
Based on our analysis of the Class of 2008, we found the following:
- The average funding received by Canadian companies in the last ten years is in second place behind the US ($25.2M),
- Canada is strongest in funding Technology companies including software, hardware and mobile, but is lagging the US in the number of healthcare companies created and our average funding per healthcare company is weak.
- Our companies go through fewer rounds of financing.
- Our average time to first funding is longer than that in the US.
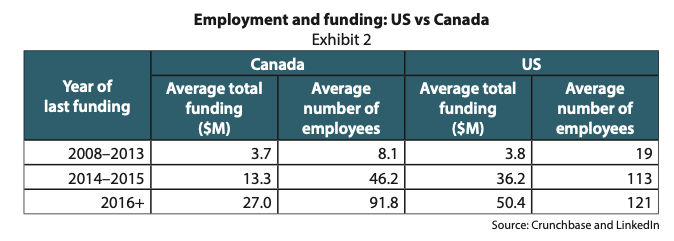
Our analysis of companies that are still active (i.e. those that have not recorded an exit) offered insight into how these firms have driven employment over the last ten years:
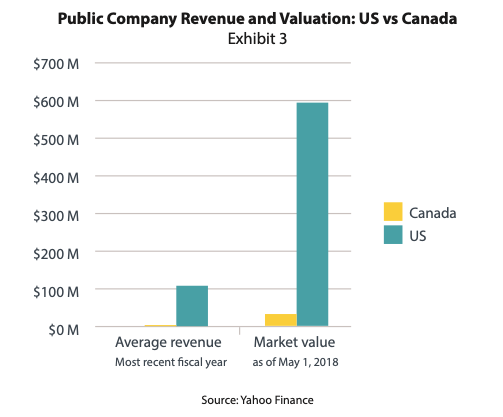
In terms of those that successfully exited, our companies have raised significantly less money before they exit. And when they IPO, they end up with significantly lower revenue and a much lower valuation.
What does this mean for the Canadian tech space? If we want to create more world-class companies, we will need to ensure that our tech companies get funding sooner and in larger amounts to be able to drive growth.
Read the full report on the Class of 2008 here.
by Charles Plant | Apr 27, 2018 | Entrepreneurship
This report examines social media in Canadian tech firms. Several of our past studies took a closer look at Canada’s challenges in growing companies. The reluctance of Canadian tech businesses to spend on sales and marketing, especially when compared to US-based firms, contributes to the slow commercial uptake of Canadian products and services.
In this study, we began to examine these sales and marketing activities in greater depth by looking at social media practices of Canadian tech firms relative to companies in other regions around the world. Social media is a critical piece a compressive digital marketing strategy and is a relatively affordable and powerful way to engage new and existing customers and build brand recognition and loyalty.
Our sample population consisted of 113 randomly selected internet software businesses in five jurisdictions: Canada, California, New York, Massachusetts, and the United Kingdom. All firms had obtained last funding in 2016, with cumulative financing ranging between $5 million and $20 million. (Unless indicated otherwise, all amounts are in US dollars.) In order to gauge Canada’s efforts and success in social media, we ranked Canadian tech companies relative to other regions using activities on LinkedIn, Facebook, Twitter, YouTube, Instagram and blogging. Overall, we rank first in effort (as gauged by activity) but unfortunately, only fourth in results, or ability to generate engagement with followers and other observers.
This analysis generates more questions than it answers. Given the degree of activity that Canadian companies put in social media channels, they are certainly not falling behind the US in their efforts at marketing communications. Given the importance of social media in generating engagement quickly and cheaply, and to do so locally and globally, we need to find out how to generate better results from our time investment in digital marketing.
Read our report on social media in Canadian tech firms.
by Charles Plant | Mar 28, 2018 | Entrepreneurship
The purpose of this report on Measuring Canada’s Scaleup Potential is to provide a data-driven approach to gauge Canada’s progress in developing a successful technology industry, one that is marked ideally by a high rate of startup creation, company growth, and ability to compete in global markets.
To understand how Canada fares, we used the notion of a ‘funnel’ in our analysis to ‘measure’ where companies are situated in Canada’s innovation pipeline, from the startup to world-class stage. We established a funnel with five stages and later combined these into two stages for purposes of comparison with other jurisdictions. We define an “Earlier” stage company as one with cumulative financing of less than $10 M, a “Later” stage company as any one that had received more than $10 M in funding.
We looked at the performance of over 2,600 technology companies in Canada, paying particular attention to 423 businesses with over $10 M of capital. We measured the companies’ relative position in the funnel to get a sense of how Canadian firms are progressing.
Based on additional analysis of revenue and employee growth and financing in public or private markets, we identified businesses with the potential to grow to world-class size, but only if they maintain current growth trajectories. For inclusion on this list, the company had to have:
- public capital above $10 M and revenue above $1 million with revenue growth rates above 20%, or
- private capital above $10 M with at least 30 employees and employee growth rates above 30%.
In total, we identified 50 Canadian companies that had met these criteria by the end of 2017. This represents 12% of all of the 423 Canadian companies above $10 M in capital.
Our analysis also looked at how Canada stacks up against other major regions in the world (the US, the UK, France, and Germany). We found some promising as well as weak points for Canada’s high-tech industry.
- We have a higher startup rate than Germany and France but trail the UK on the same metric.
- We lead all European jurisdictions in terms of scaling rates.
- We report a rate of startup and scaleup that is dramatically lower than the US and, in particular, Massachusetts, California and New York.
- We have lower rates of both startup and scaleup than Pennsylvania, Illinois, and Georgia.
While the emphasis of this report is on our ability as a jurisdiction to scale companies, we must note that there is a tremendous opportunity to improve the number of startups we generate. Although we have made significant progress in the last 10 years, the data clearly show that we have further work to do. While we tend to look to California as the ‘gold standard’, it may perhaps be more instructive to compare ourselves with New York and particularly Massachusetts, which has one of the best track records for company creation and scaling.
Read the report on Measuring Canada’s Scaleup Potential.
by Charles Plant | Mar 27, 2018 | Entrepreneurship
Canada has difficulty creating world-class companies that are research intensive and there are a number of reasons for this. In past reports we have examined management and financing practices and how they contribute to our challenges at scaling companies. In this report we want to go back to the beginning and look at the nature of technology companies that are being formed in Canada.
Research-intensive and globally competitive technology companies are currently found in four major markets: life sciences, automotive, hardware and electronics, and software. For the most part these companies serve either consumer markets or markets that focus on both consumers and businesses. Leading Canadian technology companies do not have the same focus on consumers.
While world-class life science companies have been created in many countries through the development and acquisition of novel therapeutics, Canada’s focus has not been on therapeutics. Three of Canada’s leading life science companies are in generic drug manufacturing with a further four operating in the medical marijuana market. This latter market is expected to stay restricted to Canada in the short-term due to legislative restrictions worldwide.
In addition to life sciences companies, leading research-based companies worldwide are often found in automotive markets. While we have an auto industry, we are a “branch plant economy” and do not benefit from a locally developed industry. While many new companies are now being formed worldwide to develop cars and trucks from novel automotive technology, none are located in Canada.
A third area for the development of world-class companies is in electronics and hardware. Companies like Samsung and Apple have developed successful international businesses out of proprietary technology. While Blackberry was a world leader in this market and may emerge again as dominant through supply to the auto market, we have not created many homegrown businesses focusing on consumer electronics or hardware.
That leaves us with the software market, in which Canada has many locally developed businesses but struggles to turn them into world-class contenders. The markets served by those companies can be broken down into consumer-based, enterprise-based, or a combination of the two. Data from the US and China show the following patterns:
- The largest new public software companies in the US and China have more consumer-based businesses and those that serve both consumers and enterprise customers.
- The “best” 21 venture capital (VC) deals (those with the highest returns) struck in late 2017 have centered largely on consumer-based businesses.
- The top US and Chinese Unicorns are mainly consumer-based companies.
However, Canadian software companies are typically in enterprise and small- and midsize business markets. In terms of markets, size matters, and the number of consumers that exists as potential buyers means that consumer markets are poised to be larger than enterprise markets. Thus, software companies started in consumer markets are likely to be larger than companies started in enterprise markets.
Our analysis suggests that Canada is not entering research-focused technology businesses that serve large numbers of consumers—and this is observed across the life sciences, automotive, electronics and software industries. There are several potential explanations as to why we do not drive the creation of consumer-based companies:
- We do not start them.
- We start them but fail to finance them adequately.
- We do not do a good job of growing them to world class.
If Canada wants to create larger companies, it will need to start building companies that serve consumer markets rather than business markets; and it will need to be able to finance their growth to help them overcome commercialization challenges unique to these markets.
If we want to create world-class companies we need to create them in world-class markets.
This is what Blackberry did exceptionally well. They built a company that served consumers and businesses and gave it enough fuel to become globally competitive. We have done it before, and we will have to devise appropriate strategies to boost our current track record.
Read the report on creating world class companies.