The Narwhal Project

Three years ago, I started doing research at the Impact Centre at the University of Toronto to discover the root causes of Canada’s challenges in creating a world-leading innovation economy. I thought it would be useful at this juncture to summarize our findings. This report highlights some of the issues we have identified. This blog also announces the move of our content to this new site and the launch of what we are calling the Narwhal Project, an exploration through research of what it takes to scale a tech company. I promise to blog more frequently again but meanwhile, you can check out a summary of our findings in our latest report.

For fifty years, the federal and provincial governments have been spending billions to improve our innovation economy, but without performance improvements. The usual discussion is centered on Canadian businesses and their lacklustre performance on research and development (R&D) and intellectual property (IP) protection. In addition, our productivity has lagged relative to the US because of insufficient investments into productivity-enhancing technologies, along with the lack of available capital and talented people to grow technology firms. 

But we believe that a critical challenge is our inability to scale companies to a world-class size. Larger companies boast several advantages. They have greater revenue per employee, pay better salaries, undertake more R&D, and take out more patents.

We lack large companies, particularly in the technology sector. We have only one Unicorn (with perhaps another one qualifying but not listed as such at the date of this publication) compared with over 150 in the US. Few tech companies in Canada grow large enough to go public. This means less R&D, fewer patents, and, ultimately, lower income per capita and productivity. 

Perhaps the solution to our innovation challenge is not more R&D and more patents, but rather scaling and building of companies. But why are we challenged do this in the tech field? What we have found is that:

  • Few Canadian companies are founded in large consumer markets capable of generating the desired scale.
  • We invest less per company relative to the US.
  • Canadian firms spend less on marketing and sales (M&S), activities that are critical to building the customer base.
  • We have fewer qualified people in marketing functions.

The underinvestment and underspending result in lower growth rates for Canadian tech firms compared to their US counterparts. Fundamentally then, Canadian firms do not look as attractive as potential investments due to slower growth. Because of this, they do not attract large amounts of late-stage capital and are often sold before they can scale to world-class size.

All of these factors converge to create serious barriers to growth of Canadian companies, thus necessitating smarter and more strategic thinking about how we will overcome these challenges.

You can get a full copy of the report here.

Your Path to an IPO

Over the last four years, there have been substantial changes in initial public offerings (IPOs) in the software world. Firms tend to wait longer to go public, while raising larger late-stage private rounds and eventually experiencing high public market valuations. We wanted to take a closer look at this trend with the objective to gain some insights into current practices. To that end, we looked at the results of 58 software companies that have gone public in the US since 2013.

The data suggests that the average gestation period for firms pursuing an IPO has increased from just over eight years to about 12 years, resulting in a 50% increase in the time firms stay private before going public. The average revenue of the firms at the time of the IPO has increased from under $100 million to over $300 million. As a result of this change, there has been a dramatic increase in the capitalization of these firms, both before and after going public.

For firms that have taken venture capital money and who hope to go public, there are a number of lessons and current practices that can be learned from the set of software firms analyzed in our study:

  1. Firms should consider raising money as early as possible (even in their first or second year of existence) and should also get in the habit of fundraising more frequently (every 18 months).
  2. Although the amount raised can start below $10 million, companies should strive to quickly increase that amount, even to the rate where a firm has a financial velocity of above 20. (An example of this would be a firm that raises a minimum of $100 million over the first five years of its existence.)
  3. Firms should not be discouraged by losses and should even expect to lose considerable amounts of money in order to drive growth. As the data shows here, firms with $10-$50 million of revenue suffered average losses of 69% of revenue, but this rate declined to 26% when firms grew to above $250 million in revenue.
  4. Businesses should consider spending more on M&S. Among the firms studied here, the biggest expense line was for M&S which took 64% or revenue for firms with $10-$50 million of revenue, but declined to 38% when firms reached $250 million in revenue.

Entrepreneurship Education in canada

This report on Entrepreneurship Education in Canada was primarily authored by Tihana Mirkovic. Higher education institutions have always played a major role in discussions on R&D and knowledge creation activities that are thought to contribute to a country’s competitive advantage on a global scale. While scientific entrepreneurship and related technology transfer have been practiced on campus in Canada and elsewhere for decades, the extent to which on-campus entrepreneurship and the “entrepreneurial spirit” have been emphasized among students has increased dramatically in the last decade. In response, the interest in the field of entrepreneurship education has also undergone a rapid expansion, with a proliferation of programs and activities. But how far has the implementation of programs come?

Optimization of the educational framework aimed at harvesting the best talent and realizing the country’s innovation potential strongly depends on understanding the landscape of the educational opportunities in entrepreneurship and innovation at Canada’s top universities. Plenty of studies have proven that education certainly plays an essential role in forming attitudes, skills, and most importantly an entrepreneurial mindset (Küttim et al., 2014; Wilson, 2008). But what is the strategy behind the current academic structure aimed at encouraging entrepreneurship and innovation education across specific fields? Which students are exposed to entrepreneurship education at the undergraduate level? Which departments or faculties tend to provide entrepreneurship programs, or teach courses on topics of innovation? From which perspectives is entrepreneurship and innovation education delivered to students? Is there a systematic framework under which curricula and programs devoted to entrepreneurship and innovation education are developed?

To answer some of these questions, we analyzed the present state of entrepreneurship and innovation education in Canada. Overall, our work identified 40 programs and 281 courses at 21 Canadian universities at the undergraduate level, with the results illustrated in Exhibit 1. This work builds on the findings presented in the first part of this investigation in which we analyzed the educational and demographic portraits of 585 founders of Canada’s fastest growing tech startups (refer to our report entitled Tech Founder Education, released in March 2019). This link helped us examine if indeed the students that are accessing entrepreneurship education are also the same students that start successful tech companies.

Our findings at a glance

Our findings indicate that entrepreneurship and innovation education is predominantly offered to business students and presented through the lens of the business faculty. Taking into account the number of students across different faculties, as well as the educational background of successful tech founders, it is evident that the delivery of entrepreneurship and innovation education within universities is skewed toward business disciplines, leaving science students with limited educational opportunities, despite their eventual success as tech entrepreneurs.

  • Of the 40 programs identified: 15 are minors; 15 are concentrations; 5 are majors; and 5 are delivered as certificates.
  • The majority of the programs are taught by business faculty to business students (15 programs), or engineering faculty to engineering students (11 programs).
  • Out of the 281 entrepreneurship and innovation courses offered, 50.9% are taught by business faculty.
  • 43.8% of courses are either electives, or electives with pre-requisites.
  • Course offerings by science departments are typically limited to students only from those departments, rather than the whole science student population.
  • The ratio of the number of entrepreneurship and innovation courses taught by a faculty vs. the number of students in that faculty, highlights that business students have 3.3 times more opportunity than engineers, 7.6 times more than humanities and social science students, and 8.5 times more than science students to be introduced to entrepreneurship in their specialization.
  • Our previous findings on the undergraduate education of tech founders were used to determine the index of the number of courses offered by faculty/department vs. the number of tech founders specialized in that field. The results indicate that that index for business majors is 3 times higher than for humanities and social science, 6.7 times higher than for science majors, and 7.9 times higher than for engineers.

Read the full report on Entrepreneurship Education in Canada.

Tech Founder Education

This report on Tech Founder Education was written primarily by Tihana Mirkovic. With the recognition of entrepreneurship playing a key role in economic growth and relevance for society, it has climbed up on the governments’ priority lists and a growing interest in entrepreneurship education has been voiced by officials, universities and students. Before we take a closer look at the current state of entrepreneurship and innovation education at Canada’s top universities, in this report, we present an analytical portrait of the educational background of some of Canada’s leading entrepreneurs. Did they receive a university education, or were they college dropouts as typically portrayed in the media? What were the most popular bachelor’s degrees in? How many founders went to graduate school? Did they have to be professors in order to realize their potential, or did they all need an MBA to make it in the startup world? Where were they educated? Is it typically men or women who start companies and how old are the founders?

To research the educational and demographic profile of entrepreneurs in Canada, we focused on the founders of Canada’s private tech companies that had accumulated funding above five million dollars. We have examined 585 founders across 335 Canadian tech companies (Exhibit 1). The companies in the study have been broadly subdivided to belong to eight different industry sectors, five which are more technical, including computer hardware and services, electronics, mobile and telecommunication, internet, and software. The other three that are more distinct include the industrial, healthcare and consumer products and services sectors. Internet, mobile and telecommunication and healthcare were the most dominant sectors for startups in this study. Most of the companies have been founded after 2000, and only six before 1990, the oldest one having been established in 1908. The distribution of founding years and their corresponding industry sectors have been depicted in Exhibit 2.

Our findings at a glance

On the surface, the most apparent and overwhelmingly clear results in our study indicate that most tech entrepreneurs are highly educated (Exhibit 1). There are, however, significant demographic differences that have also been observed once area of educational specialization of these entrepreneurs and the industry sector of the startups have been taken into account.

  • 95.4% of all startup founders have a bachelor’s degree.
  • At 34.9% of all undergraduate degrees, engineering was the most popular, followed by science at 21.4%.
  • Founders with business, computer science or humanities and social sciences undergraduate degrees represented a smaller fraction, each at 12–14%.
  • The vast majority, 79.8%, of founders received their undergraduate education at one of Canada’s universities, top five being University of Waterloo, University of Toronto, University of British Columbia, Western University and McGill University.
  • 50.9% of those with a bachelor’s degree, also obtained a graduate degree. The most common graduate degree was a PhD.
  • The second most prevalent graduate degree was an MBA, primarily taken by engineering and humanities, and social science students, whereas science students obtain very little business education.
  • Scientists attain the highest level of education overall: 85% of undergraduate degree holders go to graduate school, while only 19% of business students get a second degree. 37% of founders with a science backgrounds hold professorships, while none of the founders with a business undergraduate degree hold academic positions.
  • Only 5.8% of startup founders are women. Women with graduate degrees in humanities or social sciences make up 37% of that educational demographic – by far more than in any other sub-discipline.

Read the full report on Tech Founder Education

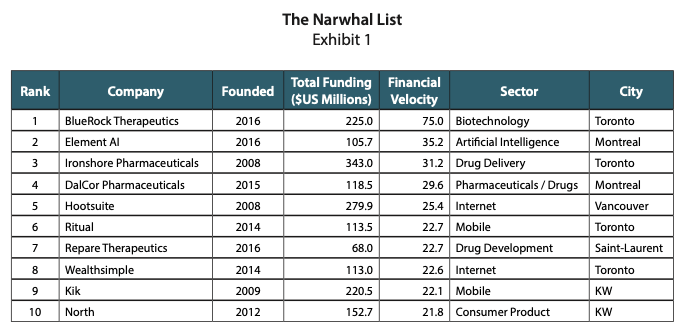
The Narwhal List 2019

2018 was another remarkable year for Canadian Narwhals and we are pleased to introduce the Narwhal List 2019 here. In brief:

17 new companies joined the list last year, replacing others that no longer qualify for the list.

  • 17 new companies joined the list last year, replacing others that no longer qualify for the list.
  • Compared to the year before, we almost doubled the number of firms on track to become Unicorns in the near future.
  • The list had a strong cohort of 25 technology companies that raised, on average, $40 million, and two healthcare companies, each averaging $100 million in new capital.The average financial velocity in the technology sector increased from 9.4 to 12.8.
  • Entry to the Narwhal List is becoming more exclusive: the minimum financial velocity for entry is now 6.7 (compared to 4.7 in 2017).
  • Although none of the firms on last year’s list went public in 2018, none were sold—a hopeful sign of retention in Canada.

What is highly disappointing though is that Canada has yet to produce a Unicorn since Kik Interactive became one in August of 2015. That’s over three years without producing a Unicorn when we should be producing between two and five a year. In fact since Kik became a Unicorn, 19 US companies were founded and became Unicorns.

Exhibit 1 features the ten leading Canadian Narwhals.

Read the full Narwhal List 2019 here.

Physical Technologies Part 2

This report entitled Physical Technologies Part 2 is a continuation of another report you can access here. In November 2017, we issued a report on the challenges that companies in the physical technologies face in obtaining government support for commercialization. This was followed by a symposium held in February 2018 with over 100 entrepreneurs, academics, government officials, advisors, investors and other interested parties. They had a robust discussion around the challenges outlined in that report and identified a number of other hurdles, including:

  • Weak institutional support structure
  • Knowledge and information gaps
  • Lack of critical mass
  • Lack of prototyping facilities
  • Absence of short-run manufacturing
  • A missing global perspective
  • Regulatory challenges
  • Difficulties sourcing talent
  • Lack of government support
  • Problems with access to capital

Participants offered a range of creative solutions to these and other challenges. What emerged from these discussions is summarized in the remainder of the report. One potential path to overcome some of the barriers holding back entrepreneurs and innovators is the creation of small local clusters focused on individual physical technologies.  

Not to be confused with the Superclusters launched recently by Innovation, Science and Economic Development Canada (ISED), the creation of local clusters can be done simply and cost effectively. Access to resources and services for cluster members such as peer-to-peer sessions, events, and training is a good starting point to address the challenges identified by the physical technology community. With small local clusters in place there are opportunities for further growth through the provision of centrally developed services and government support that can reach cluster members efficiently.

Read Physical Technologies Part 2 here.