Part of our national angst bemoans the lack of Canadian investors in Canadian Unicorns. I used to think that was a problem but lately I’ve come to think I was wrong. This new thinking was emphasized by a blog by Danilo Tominovic. Danilo has done a good job raising the issue but there appears to be a bit of data missing from the list in his blog. I can’t resist a good bit of research so here we go.
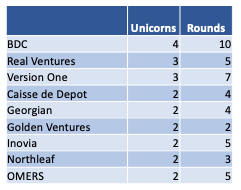
According to CBInsights, we have 19 Unicorns. That’s like 17 more than a couple of years ago so we’re heading in the right direction. These Canadian Unicorns have a total of 408 investors including duplicates. Most of these are institutional except primarily for Dapper Labs which has whack-load (116) of investors, most of them angels (shout out to Ashton Kutcher). I didn’t count Canadian Angels but I did count Canadian VCs and there are 37 Canadian VCs that made 52 investments in 85 rounds.
I guess the question is whether 52 investments out of 408 is a good result. On the surface it would appear that we don’t seem very supportive of Canadian companies but then you can look at it another way. It’s probably the ratio that one should expect. After all, an international firm should be getting funding internationally and given that Canada has less than 10% of the capital available internationally, we should expect that a successful international scaleup should have less than 10% Canadian funding. So having 13% of the investments isn’t doing too bad for now.
I love to make lists so I’ve made another one. Here are the Canadian VCs active in investing in Canadian Unicorns. I’ve included the nine firms with more than one investment for your edification and enjoyment.
From only two Unicorns at the end of 2020 to 19 today shows the incredible growth in just one year in the Canadian tech ecosystem. We recently released our 2022 Narwhal List which showcases those private Canadian tech companies that are scaling successfully as of January 1.
The 2022 list shows that:
Narwhals raised an astounding $6.9 billion last year, up from $1.1 billion.
Employment levels in Narwhals increased 58% over the last two years from 17 thousand to over 29 thousand.
In 2020 there were 52 companies that are scaling at a level that will potentially propel them to Unicorn status and the current list shows 151 companies at that level.
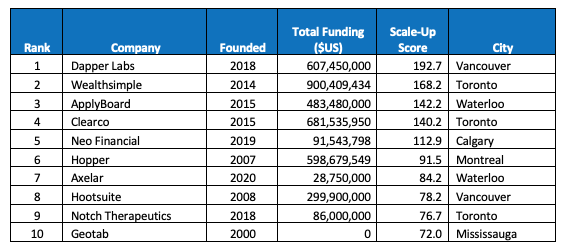
The influx of foreign funds into Canada over the last several years is fuelling this unprecedented growth. It is giving world class companies the chance to grow and stay Canadian. This is the list of Canada’s top 10 Narwhals.
In addition to a list of Canadian unicorns, the Narwhal List showcases the 40 leading computer technology firms and 10 in each of health and clean and health technologies.
2021 was an incredible year for Canadian Narwhals. In particular, eight companies from last year’s list went public. (Mindbeacon, Coveo, Dialogue, D2L, Thinkific, Q4, Medavail, Li-cycle).
In a reversal of a long-term trend, only two companies were sold. (Ecobee and Precision Nano)
Toronto is home to 26 Narwhals followed by Vancouver at 19 and Montreal at nine.
Recently, we have been trying to figure out what success means for an accelerator. We understand success from a company perspective but what is success for an accelerator? Does it mean the total value created, amounts raised by participants, employment, number of Unicorns, IPOs, exits? Lots of accelerators report on how much their companies have raised (most often in aggregate), how high their valuations are or how many employees their participants now have. Aggregate ranking data, while interesting, favours those accelerators with lots and lots of participants. It says a lot about quantity but not about quality. We wanted instead to measure quality and that’s where we had to get creative.
First, we had to figure out whose perspective we should use to measure success? I think that last question is important as we have decided that the perspective that matters most is that of the participant, the entrepreneur, who places their trust in us to help accelerate their growth. We’ve looked at lots of different measures and decided to test them against other accelerators. What we did was look at the results of all participants of the largest accelerators in Canada and the US to see what we could learn. And of course, since we love sharing data, we decided to create a list of the best accelerators.
Our rankings are based on capital raised post accelerator involvement. This may be seen as a gigantic value judgement as to the purpose of accelerators but the idea behind an accelerator is to accelerate growth and a company needs capital to be able to do that. And if it isn’t capital, then why are accelerators always touting the amount raised by their participants and the value created? So yes, big value judgment but I’ll encourage anyone else come up with a different methodology and we can compare them.
To rank accelerators, we checked Crunchbase for all Canadian based accelerators, incubators, entrepreneurship programs and university programs. We got our data in the summer of 2021 and while recent, it may not be complete. If it isn’t, I would encourage these organizations to keep their data updated. To be included in the ranking, an accelerator had to have made 15 or more investments and have 10 or more companies that had received total investment of greater than $250,000. For the US, we just took the 20 largest. What we measured was as follows:
Graduation Rate
The first step in raising capital is getting a pre-seed or seed round and this measurement looks at what percentage of firms actually go on to raise such a round. We decided that a firm graduates from the accelerator if they raise over $250,000 of capital. This level removes money invested by the accelerator and shows that some party other than the accelerator itself saw merit in what the company was doing.
It was actually quite surprising to find that the average graduation rate was only 42%. There is a large range of results with accelerators such as MEDTEQ+ scoring a 70% graduation rate
Median Financial Velocity
We use financial velocity as one of the measures in the Narwhal List and we’re used it here as well. It measures the speed of raising money and there is a correlation between financial velocity and growth. We chose the median level as it doesn’t distort results in the case that one firm has raised a significant amount of funding. Only those firms that raised above $250 thousand were counted in this metric.
The median accelerator participant raised $2.1 million and the best of these was Extreme Venture Partners where the median investment raised was $4.5 million. The median financial velocity was 0.37 meaning that the median firm raised $370 thousand a year since its inception. The best was UTEST with a median financial velocity of 0.9.
Percentage High Velocity
Finally, we calculated the percentage of superstars that came out of the program. To measure that, we calculated the percentage of firms that had gone on to record a financial velocity above 10. This means that the firm has raised more than an average of $10 million a year since inception. This is the level at which firms need to perform if they want to become Unicorns or have an IPO in the US.
Of the 1,032 firms with more than $250 thousand of capital, 32 had a financial velocity of more than 10. This is actually a fairly good result given that it takes a 100 investments to create a Unicorn. CDL had by far the biggest number of super performers at 11.
I posted a blog last week about D2L’s recent IPO. In it I made what on the surface may appear to be a value judgement favouring an IPO over a merger as a means for entrepreneurs to exit. This is part of the IPO versus M&A debate. I got called on it by Nicole Coviello who asked: “Why assume they want to go public? Not every tech firm wants to or needs to.” I responded that the short answer is better returns but I promised to answer fully in a post instead of as a comment so here it is.
I went and dredged up data I had on this issue as I looked at the question myself a few years ago. Some of this data may be a bit dated but it’s all I’ve got for a quick answer. If you want a better answer, maybe someone out there can do equivalent research.
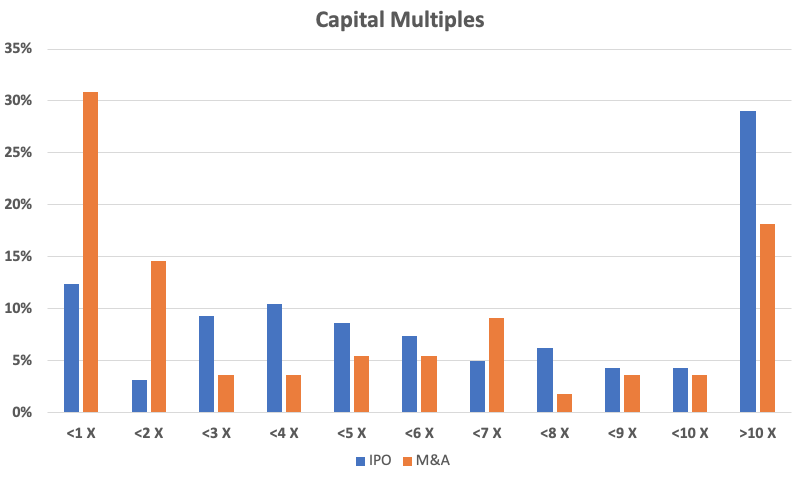
To check out rates of return for exits via an M&A event, a few years ago I collected data from CB Insights for companies in the Internet Sector (software and e-commerce) that had received more than $1 million of capital and had been sold for over $1 million at any time. In total I got data for 56 firms. The average return from this group was 7.41 times capital returned and the median was 3.52 times.
I did the same thing for IPOs checking stats I keep on all IPOs since 2013. The average return of capital from 163 software firms that exited through IPO from 2013 to 2021 was 9.7 times and the median was 5.6 times.
The following chart shows the difference between these two groups.
I’ve got other data that shows that a VC needs the average exit to have a multiple of capital returned of greater than five times to achieve an average rate of return equal to the average return over time of VC funds. This is a more complex issue as timing of investments will affect this number. An early stage VC will need a greater return of capital for instance than a later stage in order to earn similar rates of return. But I’ll save the details for another day.
So, the average IPO return of capital is 9.7 times and the average M&A return of capital is 7.41 times. The difference between return rates for IPOs versus mergers is totally logical. In the first case, there is a premium paid for liquidity and private firms earn lower valuations than public ones due to this liquidity premium. Secondly, if you are a public company buying a private one, you want an acquisition to be accretive to valuation. As a result, you’ll want to buy a firm for a lower capital or revenue multiple than you yourself are valued in the market. That way the purchase will result in a valuation bump for you.
The problem is that if you are starting a company with the intention of selling it instead of going public, you are pretty much stating that you don’t have the potential to go public and are willing to accept a lower return. Because of the difference in rates of return, any investment that a VC makes has to have the potential to go public and the fallback position for those that don’t have the economics to go public would be an acquisition. There are exceptions to this rule as some companies in hot sectors can do really well through an M&A event but for the most part the economics favour IPOs over mergers. This is why the debate between IPO and M&A isn’t really a debate. Entrepreneurs, to interest VCs should be showing why they have the potential to go public and not why M&A is their preferred route.
I was excited to be able to look at the D2L prospectus today. (Nerd alert, lotsa numbers in this post.) They have been on the Narwhal List since inception and clocked in last year in 15th spot. Many years ago they and Hootsuite were the darlings of the Canadian tech industry, expected to go public any day so seeing the D2L prospectus is great news for them and the KW community. The reason I was excited was that I was interested to understand their economics and whether I could figure out why they hadn’t gone public all those years ago when everyone expected they would.
I can’t tell what happened to D2L before 2019 but if current results are any indication I suspect they were growing too slowly to generate much interest in an IPO. Their current growth rate is 15.6%, up from 5.8% on 2020 and rumours are that pandemic fuelled spending on educational software has increased caused this increase. Even their current growth rate is not usually enough to list on Nasdaq but can get a company to the TSX. The average annual growth rate of 160 plus software companies that went public in the US in the last 8 years was over 60% (median of 44%).
That begs the question, why is their growth rate only 15.6% in the last year? Obsessing over numbers as I do, I have a few ideas. First off is capital. They had about $225 million of capital to fuel their sales growth to $126 million. At 1.78 times, their capital to revenue ratio is bang on the 1.76 times median of 160 plus other software IPOs (average of 2.27). So, they had enough capital but how did they spend it?
D2L’s ratio of marketing and sales spending (M&S) to research and development (R&D) of 1.2 times is drastically below market medians (1.9 times) and averages (2.1 times). Another indication is their spending on general and admin (G&A). It is very low compared to R&D (41%) when for the typical firm, G&A is much closer in size to R&D. It looks like their strategy was to spend more on R&D and less on M&S than typical firms do. One final indicator of this is their spending on M&S as a percent of revenue which sits at 25% of revenue and trails industry medians of 44% (average 48%.) It may be a gross oversimplification of the issue but it looks to me as if they have been a product focussed company rather than a market focussed one, interested more in building product than driving revenue.
Are you bored yet? There are still more numbers.
Setting spending as they did may have been the right decision though, as they may have been limited by their market size. Their prospectus shows their market size to be $13.6 billion in 2019 with a pandemic fuelled CAGR of 21%. This is less than half the median market size of the 160 plus companies I’ve looked at which is $29 billion. (The average is $202 billion but then this is affected by companies like Airbnb with a market of $3.4 trillion and Uber with $2.5 trillion.)
The average penetration of the market by the time of an IPO for software companies is 0.82% (median 0.55%). D2L with revenue of $103 million in a $13.9 billion market actually got to 0.74% of their market. Not bad so maybe more money on M&S wouldn’t have juiced the growth rate much further. What is exciting though are their plans for entering adjacent markets. They say in the prospectus:
“We continue to invest in our core platform and deepen our partner ecosystem to capitalize on a technological shift toward learner-centric models. We expect to expand our addressable market to include opportunities in additional areas of the broader Education Technology market, which HolonIQ expects will grow from $183 billion in 2019 to $404 billion by 2025”
This strategic shift should enable them to ramp revenue to a much higher level, if only they devote more money to M&S. And with raising $150 million they’ll have enough capital to grow revenue to $200 million hopefully at a fast enough pace to warrant a US listing.
I was searching the other day for a list of incubators and accelerators in the US that specialize in digital health. I was surprised to find how many specialize in that one sector. You can see a list of them here. The list isn’t the point though, it’s what I realized in looking at the list.
I’m sitting here in Toronto and I can access MaRS for help in building a Digital Health business. Same thing in Montreal or Vancouver. But what if I lived in Winnipeg? There doesn’t seem to be a digital health accelerator in Manitoba or in the Prairies for that matter. (There may be one or even more but I didn’t go looking.) Back to the Winnipeg startup. Would I go for help to Toronto or Vancouver? Or should I contact one of the programs in the US midwest.
I then asked myself (I do a lot of that these days) what if I lived in Buffalo? Would I go to MaRS for assistance? After all, it is the closest digital health accelerator. And Toronto is a pretty big city, fastest growing whatever. They must have a lot that would benefit me. Of course I realized that this would be ridiculous. Going to MaRS would get me access to that horrible socialized Canadian health system and all of those huge Canadian MedTech funders. Since Canada isn’t a big enough market within which to develop a digital health superpower, why would I bother going there for help?
It struck me that of course the answer is that if I lived in Buffalo, I would link up with an accelerator or incubator in the US. And then I thought (that’s two thoughts in one day – a new record), if I’m in Toronto, why should I go for help to a Canadian accelerator, wouldn’t I be better off going to a US or European based one. That’s where the customers, capital and marketing know-how are located. Getting help in Canada would only get me access to Canadian customers, capital and employees. Given that you can’t build a world-class business in Canada you’re better off going to the US (or Europe etc) right off the bat.
And so, after all that thinking, I’ve adopted a new mantra. It’s not as good as WWJD, but the same idea. If you have to make a strategic decision that relates to geography, forget where you live, don’t think locally, think globally and ask yourself, what would you do if you lived in Buffalo?